Phase
Data
|
| The TL's system response
(1 meter measurement) is the vector summation of the near field woofers response
and the near field Terminus response. Since vector summation requires magnitude and
phase, the following data sample is used to illustrate this relationship. |
|
The woofer magnitude and
phase can be modeled as a small signal response for Qtc=0.5 close box
response. Mathematically this can be described by the Beranek equations of a Plane
Circular Piston in Infinite Baffle
(1). This implies a linear phase response. While in a general case there
are serious problems with this model, this is close to what is measured for the TL36,
Fig. 1.
Note that for Fr=60 Hz the phase angle = -80° and magnitude = -8 dB. It should
be noted where the phase transition occurs, vs that of the terminus response in Fig.2. |
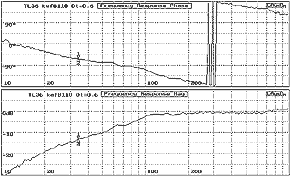
Fig. 1 TL Terminus
response for a line Dt=0.6, Dacron HoloFill II fiber
click image for larger
charts
|
Corresponding to the near
field woofer response is the near field Terminus response, Fig. 2. The Terminus response
for Fr = 60 Hz the phase angle = +19.3° and magnitude = -3.8 dB. The
measured magnitude has a 20 dB attenuation, thus the reference magnitude is 20-3.8
= +16.2 dB in reference to the near field woofer measurement.
The D phase ~99° is very close to the TL system
requirement of 90° for maximum gain @ Fr.
From this we can infer that the Dt is close to optimum for the fiber type
used.
To relate the phase of Fig.2 vs Fig.1, you have to compare the front of the woofer's
response to that of the back of the woofer's response, ie the interior of the TL
line, shown in Fig.5.
For the Terminus the phase transition does not occur at the line resonance frequency
Fr related to the 1/4l, but at the 2nd
harmonic frequency. This is important in analyzing the nulls in the TL system response
and the shift with frequency with stuffing density change. |
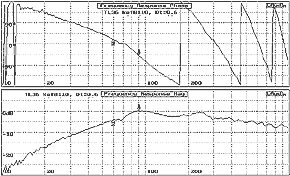
Fig. 2 TL Terminus
Response, Magnitude and Phase
click image for larger
charts
|
|
______________________________________________________________________________________
(1) Acoustics, L. Beranek, Section 5. pg 118. |
|
Unstuffed
Line Response
|
| To gain an understanding
of the TL Terminus change with Dt it is useful to examine the Terminus
response for the unstuffed line since it is the limiting case and one gains an understanding
of the 1/4l TL line resonance definition. |
|
|
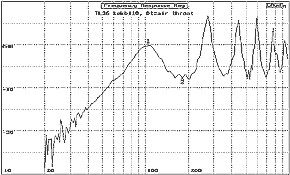
Fig.3 TL 36 TL Line
Harmonics, Terminus Response, Dtr = 1.0
click image for larger
chart
|
The TL line length
is characterized by Fr, the line 1/4 l resonance frequency and the associated
harmonics.
Two interesting effects
of the Terminus response for the unstuffed line are apparent in the plot of Fig.
3:
- The low frequency
attenuation slope, -18 dB/octave.
- The asymptotic attenuation
of the harmonics.
From the asymptotic
attenuation of the harmonics we can infer that even for the unstuffed line, Dtr=1,
air at a density of 1.18kg./m3, the attenuation function is non-linear
with frequency.
|
|
| Thus we can infer that
with fiber having a greater density than air, a more pronounced attenuation function
as well as a change in air velocity in the fiber mass will occur |
|
Table 01 TL 0.91 meters, Dtr
= 1
|
|
|
Calculated
|
Measured
|
Shift
|
Magnitude
|
|
|
| Type |
(Hz)
|
(Hz)
|
(Hz)
|
(dB)
|
Phase
|
Transitions |
|
|
| *Fr |
94.2
|
104.3
|
+12.1
+8.6%
|
+0dB
|
-56.5°
|
|
| 1st Harmonic |
188.3
|
180.8
|
-7.5
-4.0%
|
-7.6dB
|
-159°
|
|
| 2nd Harmonic |
282.5
|
273.2
|
-9.3
-3.3%
|
+6.8dB
|
+80.9°
|
233.5
|
| 3rd Harmonic |
376.7
|
352.8
|
-23.9
-6.3%
|
-7.3dB
|
-10.3°
|
|
| 4th Harmonic |
470.9
|
446.6
|
-24.3
-5.2%
|
+5.7dB
|
-134°
|
464.6
|
| 5th Harmonic |
565.0
|
533.1
|
-31.9
-5.7%
|
-8.1dB
|
+151°
|
|
| 6th Harmonic |
659.2
|
599.8
|
-59.4
-9.0%
|
+6.7dB
|
+66.5°
|
|
| 7th Harmonic |
753.4
|
688.3
|
-65.1
-8.6%
|
-7.6dB
|
-34.5°
|
|
| 8th Harmonic |
847.6
|
774.5
|
-73.1
-8.6%
|
+3.7dB
|
-116°
|
789.9
|
| 9th Harmonic |
941.7
|
871.4
|
-70.3
-7.5%
|
-6.4dB
|
+145°
|
|
| 10th Harmonic |
1035.9
|
924.4
|
-111.5
-10.8%
|
+1.0dB
|
+56.7°
|
|
|
| Note the shift in frequency
of the measured peak values from the calculated. This is not an instrumentation problem
but the byproduct of speed of sound shift. |
|
| * For TLB the
Fr for the unstuffed line @ 104 Hz moves to ~ 65 Hz= as shown in Fig.5.2, TLB system response
when stuffed. This is one of the differences from the generic TL line where the Fr
shift due to fiber density would be much smaller. |
|
| Stuffed
Line Response |
|
|
|
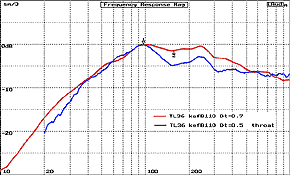
Fig. 4 TL 36 Terminus
Response Dtr = 6.8/ Dtr = 9.5
click image for larger
chart
|
Fig. 4 shows the progressive
change in the bandwidth of the Terminus with the change of Dtr. Note that
the low frequency slope hinge point at 1/4l does not change, this is a
function of line length. However the bandwidth from the 1/4l frequency changes: the high
end -3 dB point moves to a higher frequency and the odd harmonic nulls are attenuated.
These factors are a function of the fiber attenuation characteristics defined by
Bradbury's
equations.
It is interesting to compare the low frequency response of the interior of the TL
line, ie the back of the woofer, Fig. 5 to that of Fig. 4. In summary the high frequency
slope point is set by line length, however the low frequency slope frequency changes
with stuffing density. As the density is increased it approaches the fundamental
of a pressure response. |
|
|
The
TL's Interior response, ie back of the woofer's spectral response, as shown in Fig.5
documents that contrary to the popular conception that it is a mirror image of the
front of the woofer, it is fundamentally changed by the TL's line loading and is
essentially a pressure phenomena. This phenomena is complex and not discussed further
in this document.
Note that the phase from DC to the 1/4l frequency is linear. This sets
the phase response of the Terminus, though for the Terminus the additional factor
of frequency change vs. fiber density and type has to be added. |
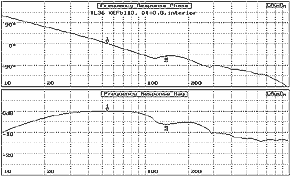
Fig. 5. TL Line, Interior Response
click image for larger chart
|
|
|
[ Back to the Transmission
Line Speaker Page
| The TLB | Appendix TOC ]
|


